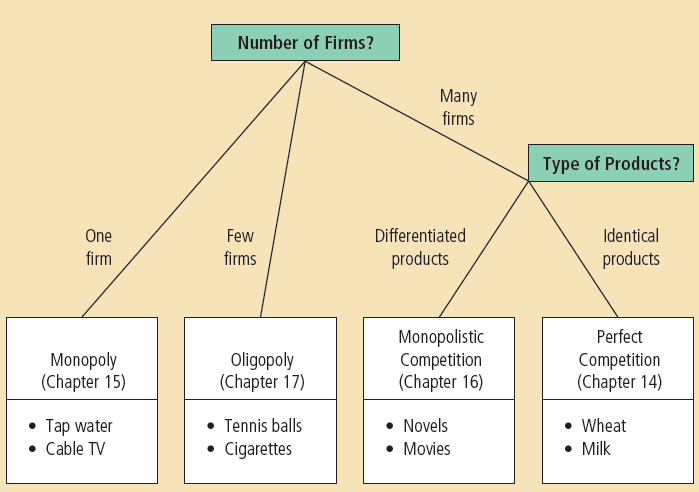
Types of Market Structure
Perfect Competition
- many firms each sell an identical product
Monopoly
- a single firm sells a single, undifferentiated product
Oligopoly
- a few firms (usually 2-4) selling either identical or an undifferentiated product (ie. steel or cigarettes)
Monopolistic Competition
- many firms each sell differentiated products
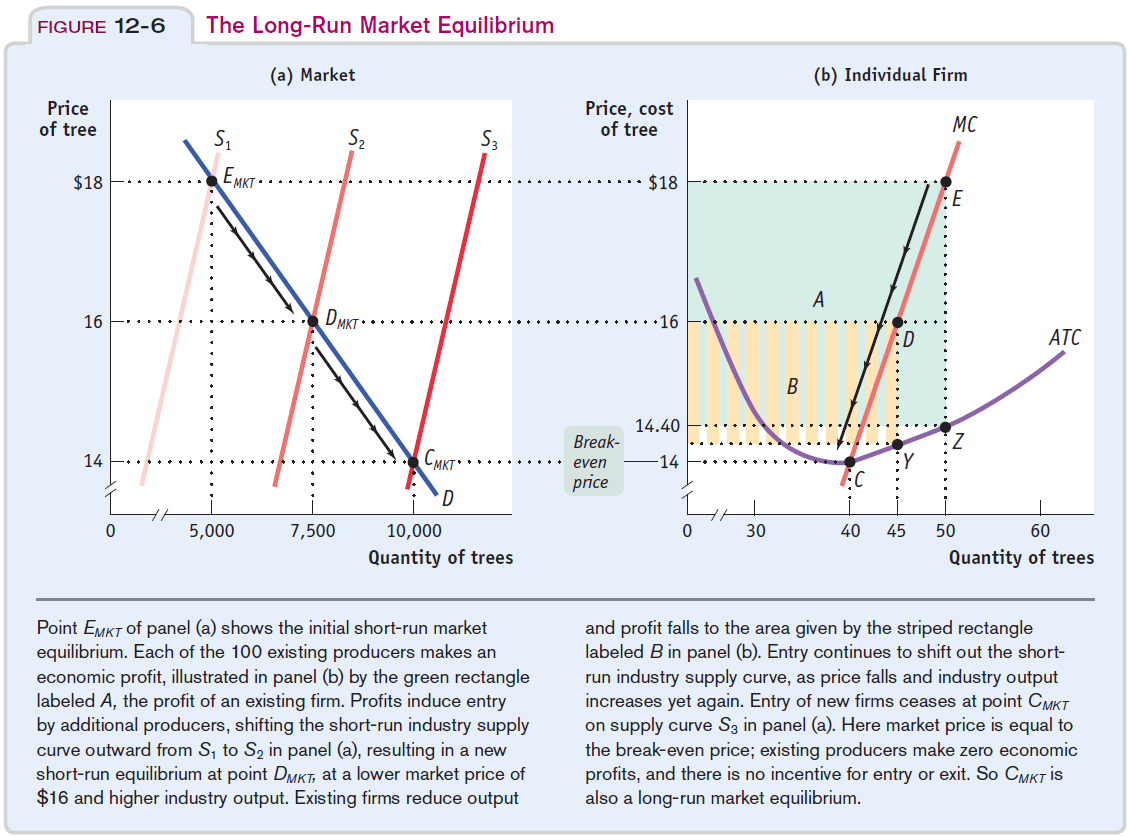
Short-run industry supply curve
Definition
- relationship between the price of a good and the total output of the industry as a whole
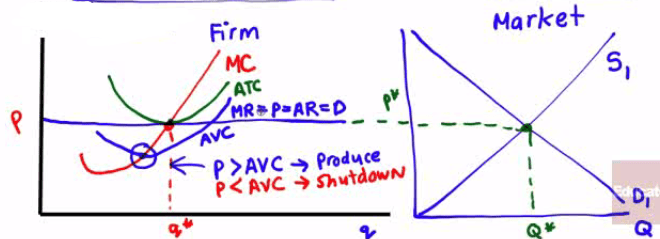
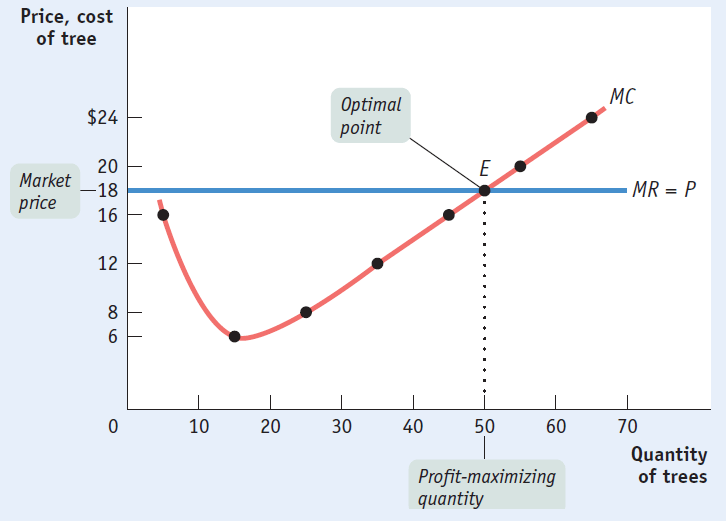
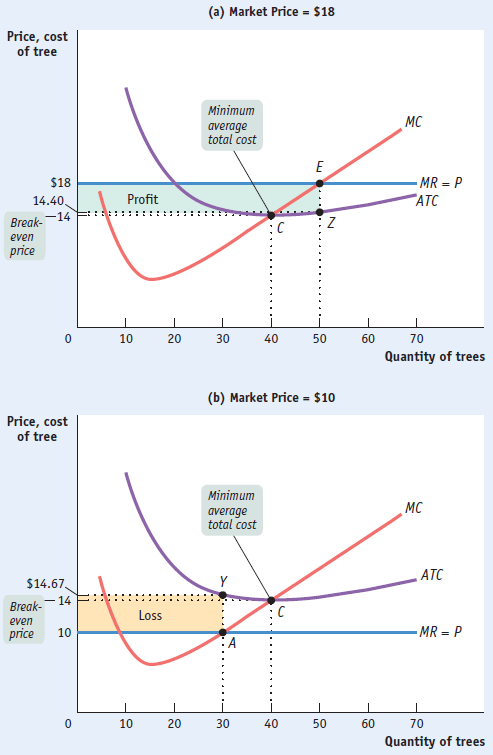
When the market price equals or exceed the shut-down price, firms will continue to produce at the point which the price equals marginal cost
At any price above the AVC, the short-run individual supply curve is the firm's marginal cost (MC) curve
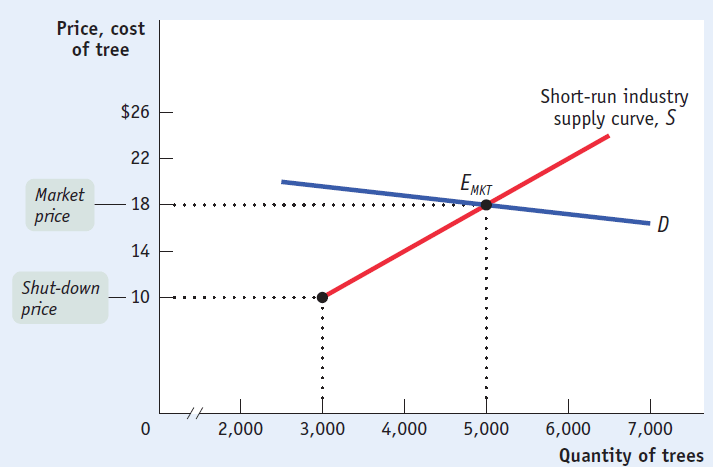
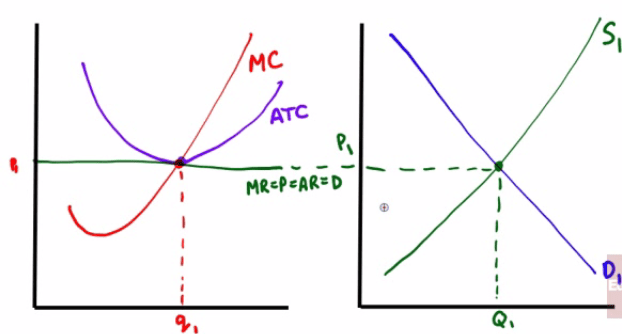
The short-run industry supply curve, S, is the industry curve.
Below the shut-down price of $10, no producer wants to produce in the short run.
Above $10, the short-run industry supply curve slopes upward, as each producer increases output as price increases.
It interescts the demand curve, D, at point EMKT, the point of short-run market equilibrium, correspongding to a market price of $18 and a quantity of 5000 trees.
Long-run industry supply curve
Meaning
- shows how the quantity supplied responds to the price once producers enter or exit the industry
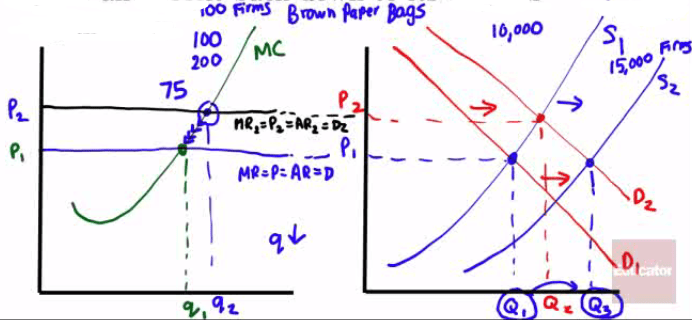
Profits cause more firms to enter, which shifts the supply curve to the right, resulting in lower prices and higher industry output.
However, individual output by firms decreases as does profit until there is no economic profit.
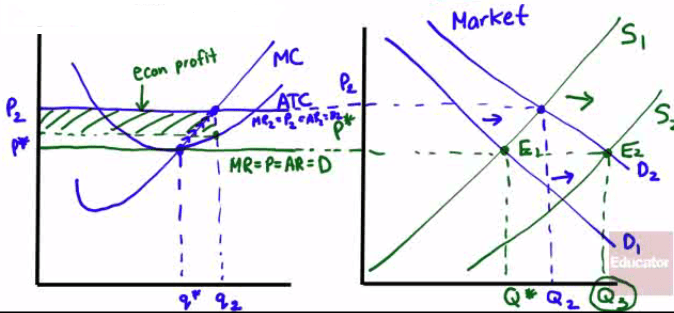
- Profit = Total Revenue - Total Cost = Price * Quantity - Average Total Cost * Quantity
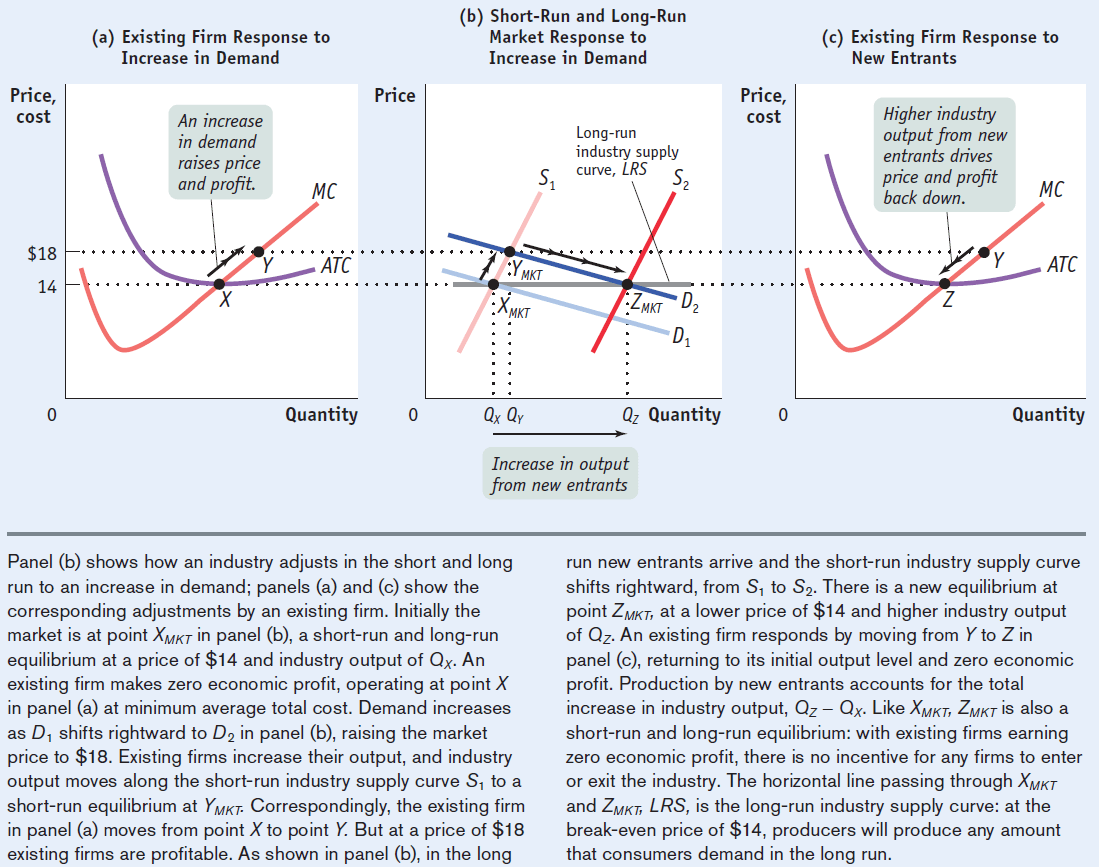
The Effect of an Increase in Demand
An increase in the demand for a product causes the equilibrium price and quantity to increase in the market.
An increase in demand raises price and profit, which causes more suppliers to enter the market
Higher industry output from new entrants drives price and profit back down to its original equilibrium
Perfect Competition
Price-taking firm
- the actions of the firm has no impact on the market price of the product
Price-taking consumer
- what consumers do have no bearing on the price of the product that is purchased
Perfectly competitive market
- all participants are referred to as price takers, taking whatever the markets gives them
Three characteristics of perfect competition
Many firms. No individual firm can have a disproportionately large market share
Item sold is a commodity, or a product that is the same no matter who sells or buys it
Free entry and exit. If there's profit, firms enter. If there's loss, firms exit.
Optimal output rule
- producing the quantity of output at which the market price is equal to the marginal cost of the last unit produced
Equation
Marginal Cost = Marginal Revenue = Price = Average Revenue = Demand
How to remember: Mc= Mr. Pard
- small q for quantity of a firm
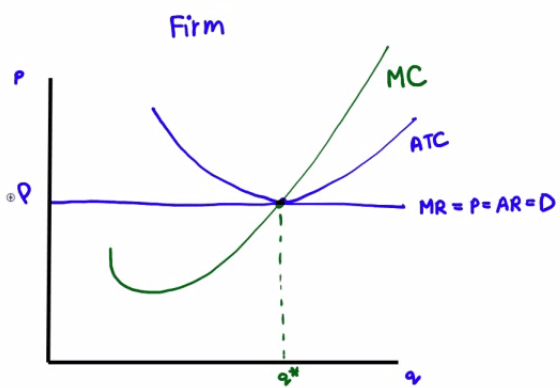
Perfect Competition in Long-Run Equilibrium
Long-run competitive equilibrium
- All firms in an industry are maximizing profit, no firm has an incentive to enter or exit, and price is such that quantity supplied equals quantity demanded
Conditions
There is no economic profit
No firms enter or leave
The market is always right
Label all points correctly!
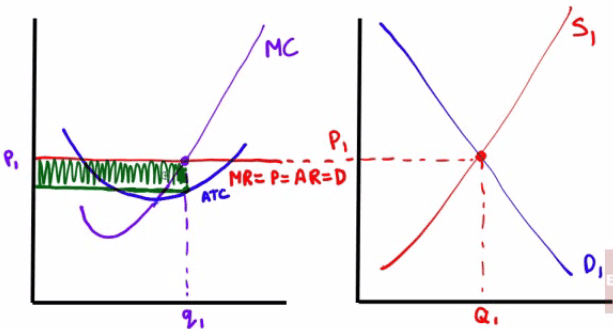
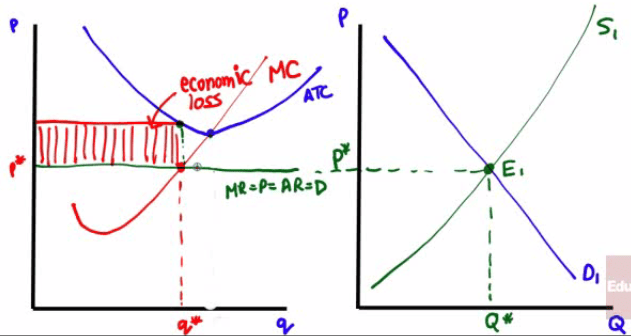
Perfect Competition and Short-Run Market Price
Making Short-Run Profit
MR = P = AR = D is above the ATC curve
Make sure the ATC and MC intersect at the minimum ATC
The market is always right!
Economic Profit shaded in green
Incurring Short-Run Loss
MR = P = AR = D is below the ATC curve
Make sure the ATC and MC intersect at the minimum ATC
The market is always right!
Economic Loss shaded in red
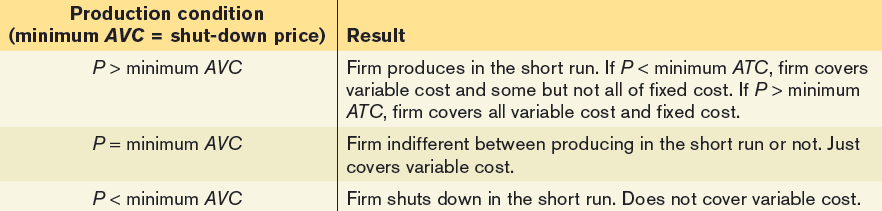
Summary
Summary of Profitability and Production
- Long-run (Profitability)
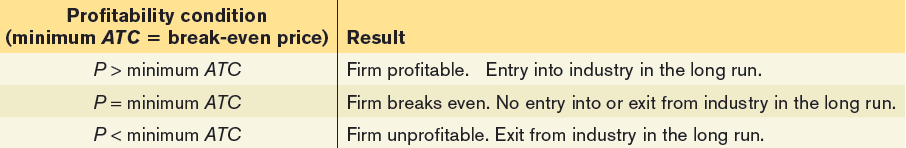
- Short-run (Production)